Millions of people play 6-from-45 lotteries. They buy tickets everywhere — at dedicated lottery counters, convenience stores, newsstands, gas stations on their way somewhere, and more and more often, online. What unites them all is one thing: the desire to guess right and win. Everyone wants to win, but sadly, only a handful ever do. So this article is for anyone who genuinely wants to win the lottery. Let's dig into the numbers.
Let's start by answering two questions right away:
Can you guarantee a 100% win in the lottery?
- No. The balls come up in a genuinely random order. Unless, of course, it's your own private lottery.
Can you meaningfully improve your odds of winning?
- Yes. If you apply the approach we'll walk through below.
So, I want to walk through this method using a standard "6 of 45" lottery as the example.
Let's start with the basics. Lottery (from the Italian lotto, meaning "fate" or "destiny") — in our context, a lottery is a game of chance where the outcome depends on the random draw of a ticket, number, or ball. I want to stress that the draw happens in a genuinely random order. From basic probability theory, it's easy enough to work out that the odds of matching all six numbers in a "6 of 45" lottery come to 1 in 8,145,060 — and it's obvious to anyone, math background or not, that those odds are pretty slim. Below, I'll walk through my analysis and show how you can meaningfully improve your odds of winning the lottery.
Here's what I started with: I used a program that simulates a lottery drawing machine and ran roughly 10,000 drawings of a 6-from-45 lottery. A clear pattern started showing up after only about 50 drawings, but I wanted to confirm it held up over a much larger sample. As a spoiler, the results I got lined up perfectly with results from actual real-world lottery drawings, which you can find right here on this site — for each lottery, I only show the analysis for the highest and lowest ball to keep the chart readable, but that's enough to pin down the likely lowest and highest numbers, since the charts show these ranges rarely overlap (these are raw counts, not converted to percentages — real drawing data). For example: the American Powerball lottery. I logged every result and immediately built a chart (in percentages). The chart shows the probability of each number (from 1 to 45) being drawn.

This chart turned out to be interesting mostly for its "elegance," rather than for actually helping with lottery analysis — yes, there's some spread in the odds (the probability of any given number being drawn ranged from 2.12% to 2.33%, out of 10,000 drawings), but from a practical standpoint this chart doesn't really tell us much, since the spread is so small it's not worth relying on.
Here's what I did next. Since it makes no difference in what order (first, second, ... sixth) a given ball comes up during a drawing, I sorted the numbers in ascending order for every single drawing. Here's a quick example to make that clearer: in drawing #4118, I got the combination 16/28/4/42/10/35, which I rearranged into 4/10/16/28/35/42. I did this for all 10,000 drawings.
Next, for analysis, I numbered each position and color-coded it — the smallest ball in each drawing became position one, colored blue, all the way up to the largest, sixth ball, colored orange. That's when a relationship started to emerge, so I immediately built a chart to visualize it.
On the chart below, you'll see which position tends to land on which values, and with what probability.
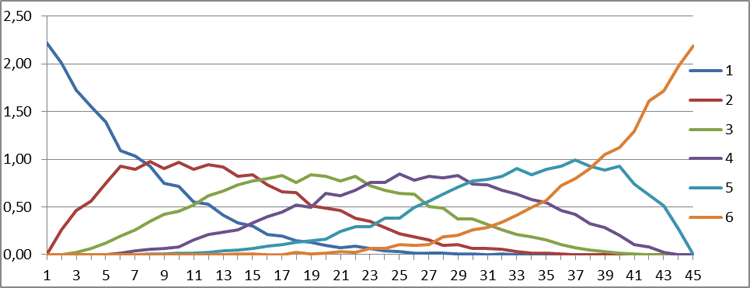
Sure enough, it turned out the smallest number in any drawing was never (0% probability) higher than 33, while the largest number always fell somewhere between 14 and 45. The chart makes it easy to see exactly which position tends to land on which values. Worth noting: if you add all these probabilities back together, you get our first chart — the one that initially seemed completely useless.
The takeaway is pretty clear: you're more likely to see Winston Churchill sit down next to me and dictate the rest of this article than to see a 6-from-45 lottery draw the combination 1/2/3/4/5/6 (even though that seems to run against "ordinary" probability theory a little).
The analysis of this lottery doesn't stop there — the chart above covers every possible outcome (100%), including extremely unlikely ones. For example, the smallest number rarely comes in above 15, so I trimmed the low-probability tail off each position's range.
The chart below shows the same kind of distribution, but scaled down to 90% probability instead of 100%.
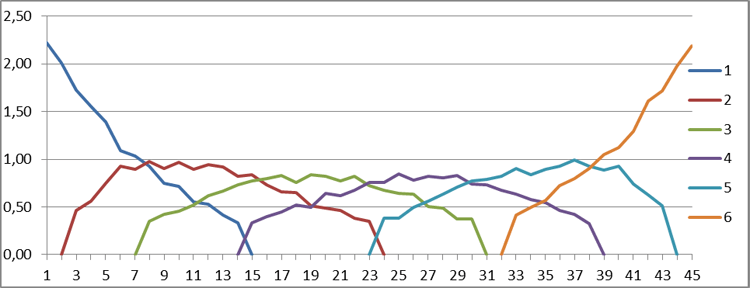
As you can see from the chart, the range for each ball position narrows significantly, while the overall probability only drops by 10%.
I kept experimenting from there, gradually narrowing the overall probability down to 50%. Just for fun, here are a few more of those charts.
Chart for 80%.
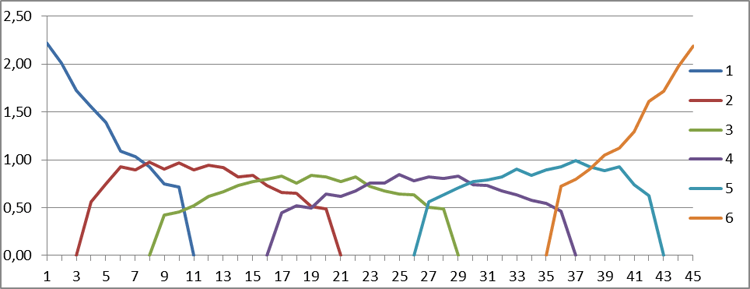
Chart for 70%.
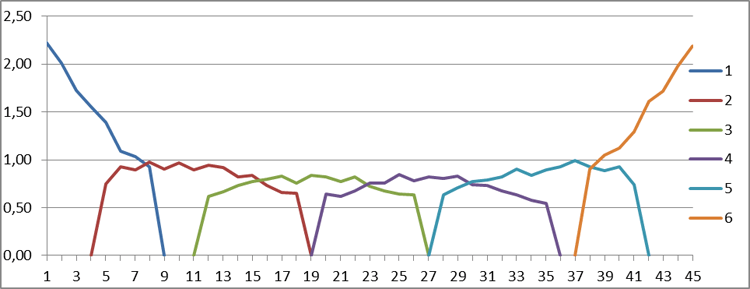
Looking at this last chart: the first (smallest) ball tends to fall between 1 and 9, the second between 4 and 19, the third between 11 and 27, the fourth between 19 and 36, the fifth between 27 and 42, and the sixth (largest) between 37 and 45. Keep in mind these ranges only hold with 70% probability. How aggressively you want to trim the low-probability values is entirely up to you.
Anyone can run this same kind of analysis on any lottery and see exactly what I saw — meaningfully improving your odds of winning really is achievable.
If any of this made sense, it's time for the main takeaway.
Sure, the odds of any individual number coming up are technically equal, and pretty small either way — but in practice, the odds of a specific combination like 1/2/3/4/5/6 actually being drawn are close to nonexistent. If you play the lottery without applying this kind of approach, you're leaving real value on the table. Picking numbers because they form some pretty pattern on the ticket won't help much, unless that "pattern" happens to line up with what this lottery analysis shows. But choosing numbers based on the patterns above can genuinely boost your odds of winning by a wide margin.